
The Solar Energy Industries Association and Wood Mackenzie published their quarterly Solar Market Insight Report for 2022 on December 13. The report provides key information about the US solar industry across all market segments: residential, commercial, community and utility. The data in the report includes average solar PV system pricing for each market segment, compared with data from one year ago.
In general, the US solar industry is facing a mixed outlook. Q3 2022 has been the best quarter on record for the residential solar market with over 1,500 MW installed, and the Inflation Reduction Act has increased and extended the federal tax credit for solar installations. However, the US solar industry has also been dealing with a shortage of photovoltaic modules due to a series of supply chain issues. Small-scale solar installers can rely on locally manufactured modules, but larger projects depend on imports.
In spite of supply chain hardships, solar power remains the fastest growing electricity source in the US, representing 45% of the generation capacity installed between January and September 2022. Even faster growth would be possible if large-scale solar developers were not being affected by a PV module shortage.
Get a professional solar PV system design for your commercial building and qualify for incentives.

Three states have been leading the way in solar installations during the last three years: California, Texas and Florida. The capacity additions by these states in Q1-Q3 2022 are summarized below:
- California: 3,187 MW
- Texas: 2,325 MW
- Florida: 1,578 MW
The Residential Solar Market Broke Records Again in Q3 2022
According to the SMI report, the US installed 1,568 MW of residential solar capacity during Q3 2022, breaking previous records. Home solar installations have been steadily growing in the US during the last four quarters, as you can see in the following table:
|
Quarterly Period |
Residential Solar Growth |
|
Q3 2021 |
1,073 MW |
|
Q4 2021 |
1,156 MW |
|
Q1 2022 |
1,247 MW |
|
Q2 2022 |
1,358 MW |
|
Q3 2022 |
1,568 MW |
The US surpassed 1,000 MW of home solar installations in a single quarter for the first time on record in 2021. The quarterly Solar Market Insight has reported steady growth since then, and residential installations surpassed 1,500 MW for the first time on record in Q3 2022.
California installed 571 MW of home solar capacity in Q3 2022, representing over one-third of the total capacity added in this market segment. Texas was in 2nd place with 150 MW, while Florida was in 3rd place with 130 MW. Together, these three states added 851 MW of residential solar power, representing 54% of nationwide growth.
Commercial and Community Solar: Modest but Steady Growth
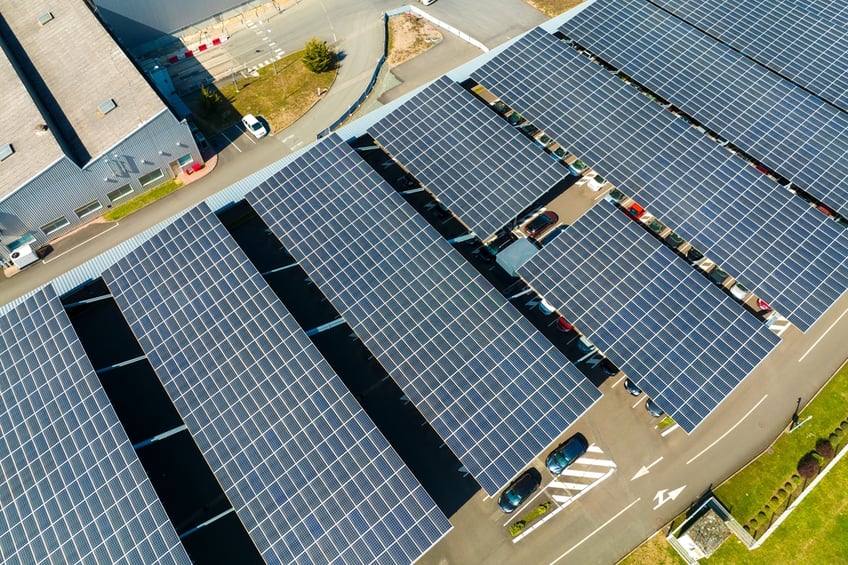
Compared with the residential solar market, the commercial and community market segments are smaller. The SEIA and WoodMac reported 340 MW of commercial solar capacity and 212 MW of community solar capacity in Q3 2022, reaching a combined capacity of 552 MW. Due to their scale and the number of PV modules involved, community and commercial solar projects are more vulnerable to supply chain issues.
New York is the leading state in the community solar market by far, representing 60% of the capacity added during Q3 2022. California could also become a promising market thanks to new legislation that favors community solar projects, and the SMI report is forecasting 570 MW of new installations between 2024 and 2027.
In the commercial solar market, the SMI report forecasts an average annual growth of 7% through 2027. Both commercial and community solar projects can benefit from new incentives introduced by the Inflation Reduction Act, and this will contribute to faster growth.
Utility-Scale Solar Power: Dealing with Supply Chain Issues
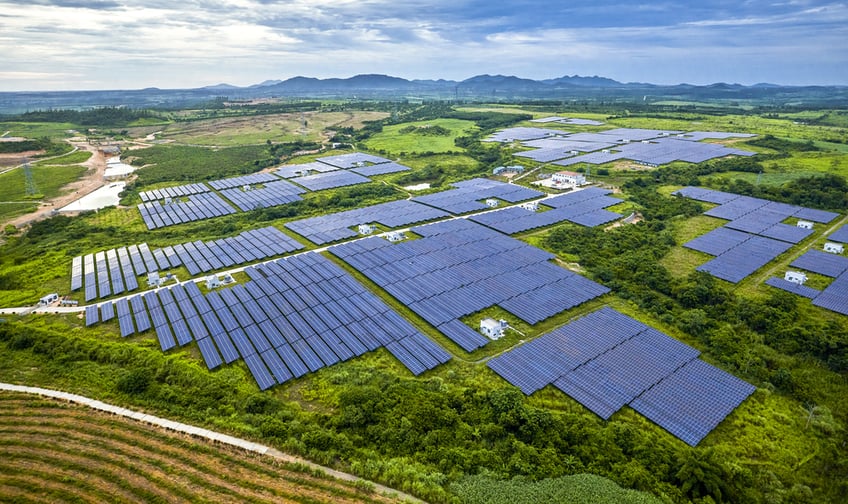
Large solar projects are the most affected by supply chain issues, and this is reflected in the installation volumes reported. The US installed 2,460 MW of utility-scale solar power during Q3 2022, and cumulative installations for the year (Q1-Q3 2022) are at 7.4 GW, which is 33% less compared with 2021.
Supply chain issues have been the main cause of project delays in 2022. Solar developers faced the Withhold Release Order (WRO) last year, the possibility of new anti-dumping and countervailing duties (AD/CVD) earlier in 2022, and now the Uyghur Forced Labor Prevention Act (UFLPA) in the second half of 2022.
- The US Department of Commerce is detaining solar panel shipments under the UFLPA, and developers must submit documentation proving there is no forced labor involved.
- Quartzite sourcing documentation is especially difficult to obtain, and many utility-scale solar projects are paused due to withheld shipments.
In spite of current hardships, the SEIA and WoodMac are expecting a much better outlook for utility-scale solar projects during the next five years. A faster installation rate is expected as supply chain issues are solved, and the Inflation Reduction Act takes effect. The SMI report is forecasting a project pipeline of 150 GW by 2027, and annual installation could reach 30-40 GW.

