Wind and Solar: The Fastest Growing Electricity Sources in the US
.jpg?width=1750&height=276&name=shutterstock_1723524880%20(1).jpg)
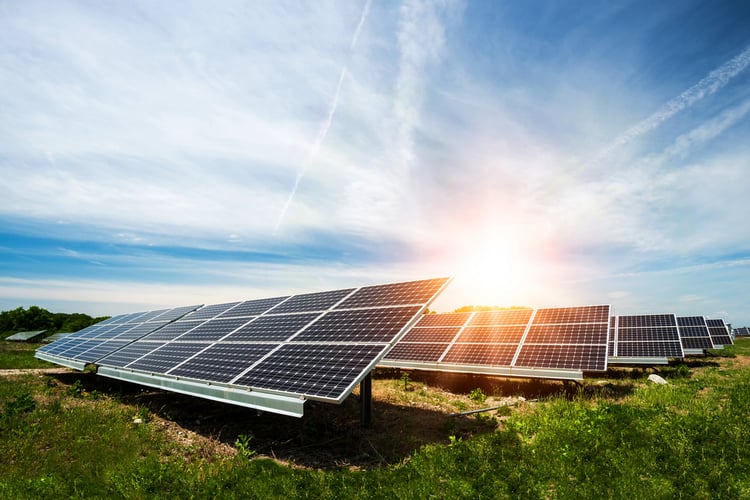
Generating electricity with solar panels and wind turbines is now cheaper than using coal or natural gas. Wind and solar power were emerging technologies with a minimal market share back in 2000, but they are now the fastest-growing electricity sources in the US. According to the Solar Energy Industries Association (SEIA), solar power accounts 43% of the capacity added in 2020, while wind power accounts for 38%. Together, both technologies represent 81% of new electricity generation in the US.
California is the top solar power state with 31.3 GW installed, while Texas is the top wind power state with 31 GW. At the start of 2021, the US had 97.2 GW of solar power and 122.4 GW of wind power. This means California is home to 32% of the solar capacity, while Texas has 25% of the wind capacity.
Are you considering renewable energy for your construction project? Get a professional assessment and reduce your power bills.
Like any technology, solar panels and wind turbines have limitations. They can only generate electricity when their respective resource is available - sunlight or blowing wind. Solar and wind power can help reduce electricity costs, but they must be combined with other sources such as hydroelectricity and fossil fuels to ensure a reliable power supply. Combining solar panels and wind turbines with batteries is also a promising concept, but the applications of energy storage are still limited by its high cost.
Solar Power: The Fastest Growing Electricity Source in the US

In spite of the COVID-19 pandemic, 2020 was a record year for the US solar industry. The new capacity added was 19.2 GW, bringing the total to 97.2 GW. Since the 26% federal tax credit for solar power was extended for two years, this growth can be expected to continue. According to the SEIA, the solar generation capacity that has been installed so far in the US can produce electricity for 17.7 million homes.
- Utility-scale solar farms represent the lion’s share of new capacity, with almost 14 GW deployed in 2020. The project pipeline is even larger, with 69 GW under development and construction.
- Home solar power grew by 3.2 GW, while the non-residential sector grew by 2 GW.
Solar power is affected by economies of scale, and project costs decrease as the installed capacity increases. According to the most recent data from the SEIA, the average cost is $2.83/watt for home solar, $1.36/watt for non-residential solar, and $0.78/watt for utility solar. When single-axis tracking is added, the cost of utility solar increases to $0.91/watt.
California added the most solar power capacity among all states, with 3,904 MW of new installations in 2020. However, Texas is close behind with 3,425 MW. Florida was in third place with 2,822 MW, while Virginia was fourth with 1,406 MW. These were the four states that added over 1,000 MW of solar power in 2020, among 27 that added over 100 MW.
Wind Power: A Close Second Place after Solar Power

Wind and solar power are often mentioned together, and both generation methods produce cheap electricity with energy inputs that are virtually limitless. However, there are also important differences between solar panels and wind turbines. Solar panels are cost-effective in projects of all sizes, while wind turbines need a certain scale to be viable. Also, solar panels can be used in any unshaded roof with the structural capacity to support them, while wind turbines are very demanding in terms of site conditions.
Wind power had the 2nd highest growth among all US electricity sources in 2020, with 16.9GW of new capacity added, reaching 122.4 GW in total. Texas continues to be the wind power leader, with 4,235 MW added in 2020. However, there were other states that also deployed more than 1,000 MW of wind capacity last year:
- Iowa = 1,498 MW
- Wyoming = 1,123 MW
- Illinois = 1,029 MW
- Missouri = 1,028 MW
Onshore wind power represents nearly all the installed capacity so far, and the US only had 42 MW of offshore wind power at the start of 2021. However, the US has considerable offshore wind resources, and there are already 26 GW of projects in the pipeline. The Atlantic Coast has most of the offshore wind generation potential in the US - potentially 4.6 trillion kWh per year.
Conclusion
The US still gets 60% of its electricity from fossil fuels, according to the latest data from the US EIA. Wind and solar power represent 8.4% and 2.3%, respectively, but they are growing fast. They represent 81% of all new capacity added in 2020, while fossil fuels and all other sources represent the remaining 19%. With tax incentives and decreasing technology costs, this trend can be expected to continue.

Michael Tobias
Michael Tobias, the Founding Principal of NY Engineers, currently leads a team of 150+ MEP/FP engineers and has led over 4,000 projects in the US
Join 15,000+ Fellow Architects and Contractors
Get expert engineering tips straight to your inbox. Subscribe to the NY Engineers Blog below.

